See the thinking, not just the pitch.
Three practice projects showing how a Lean Six Sigma-based audit turns raw shop-floor data into a prioritized fix list.
Scrap & Rework Cost Analysis (COPQ)
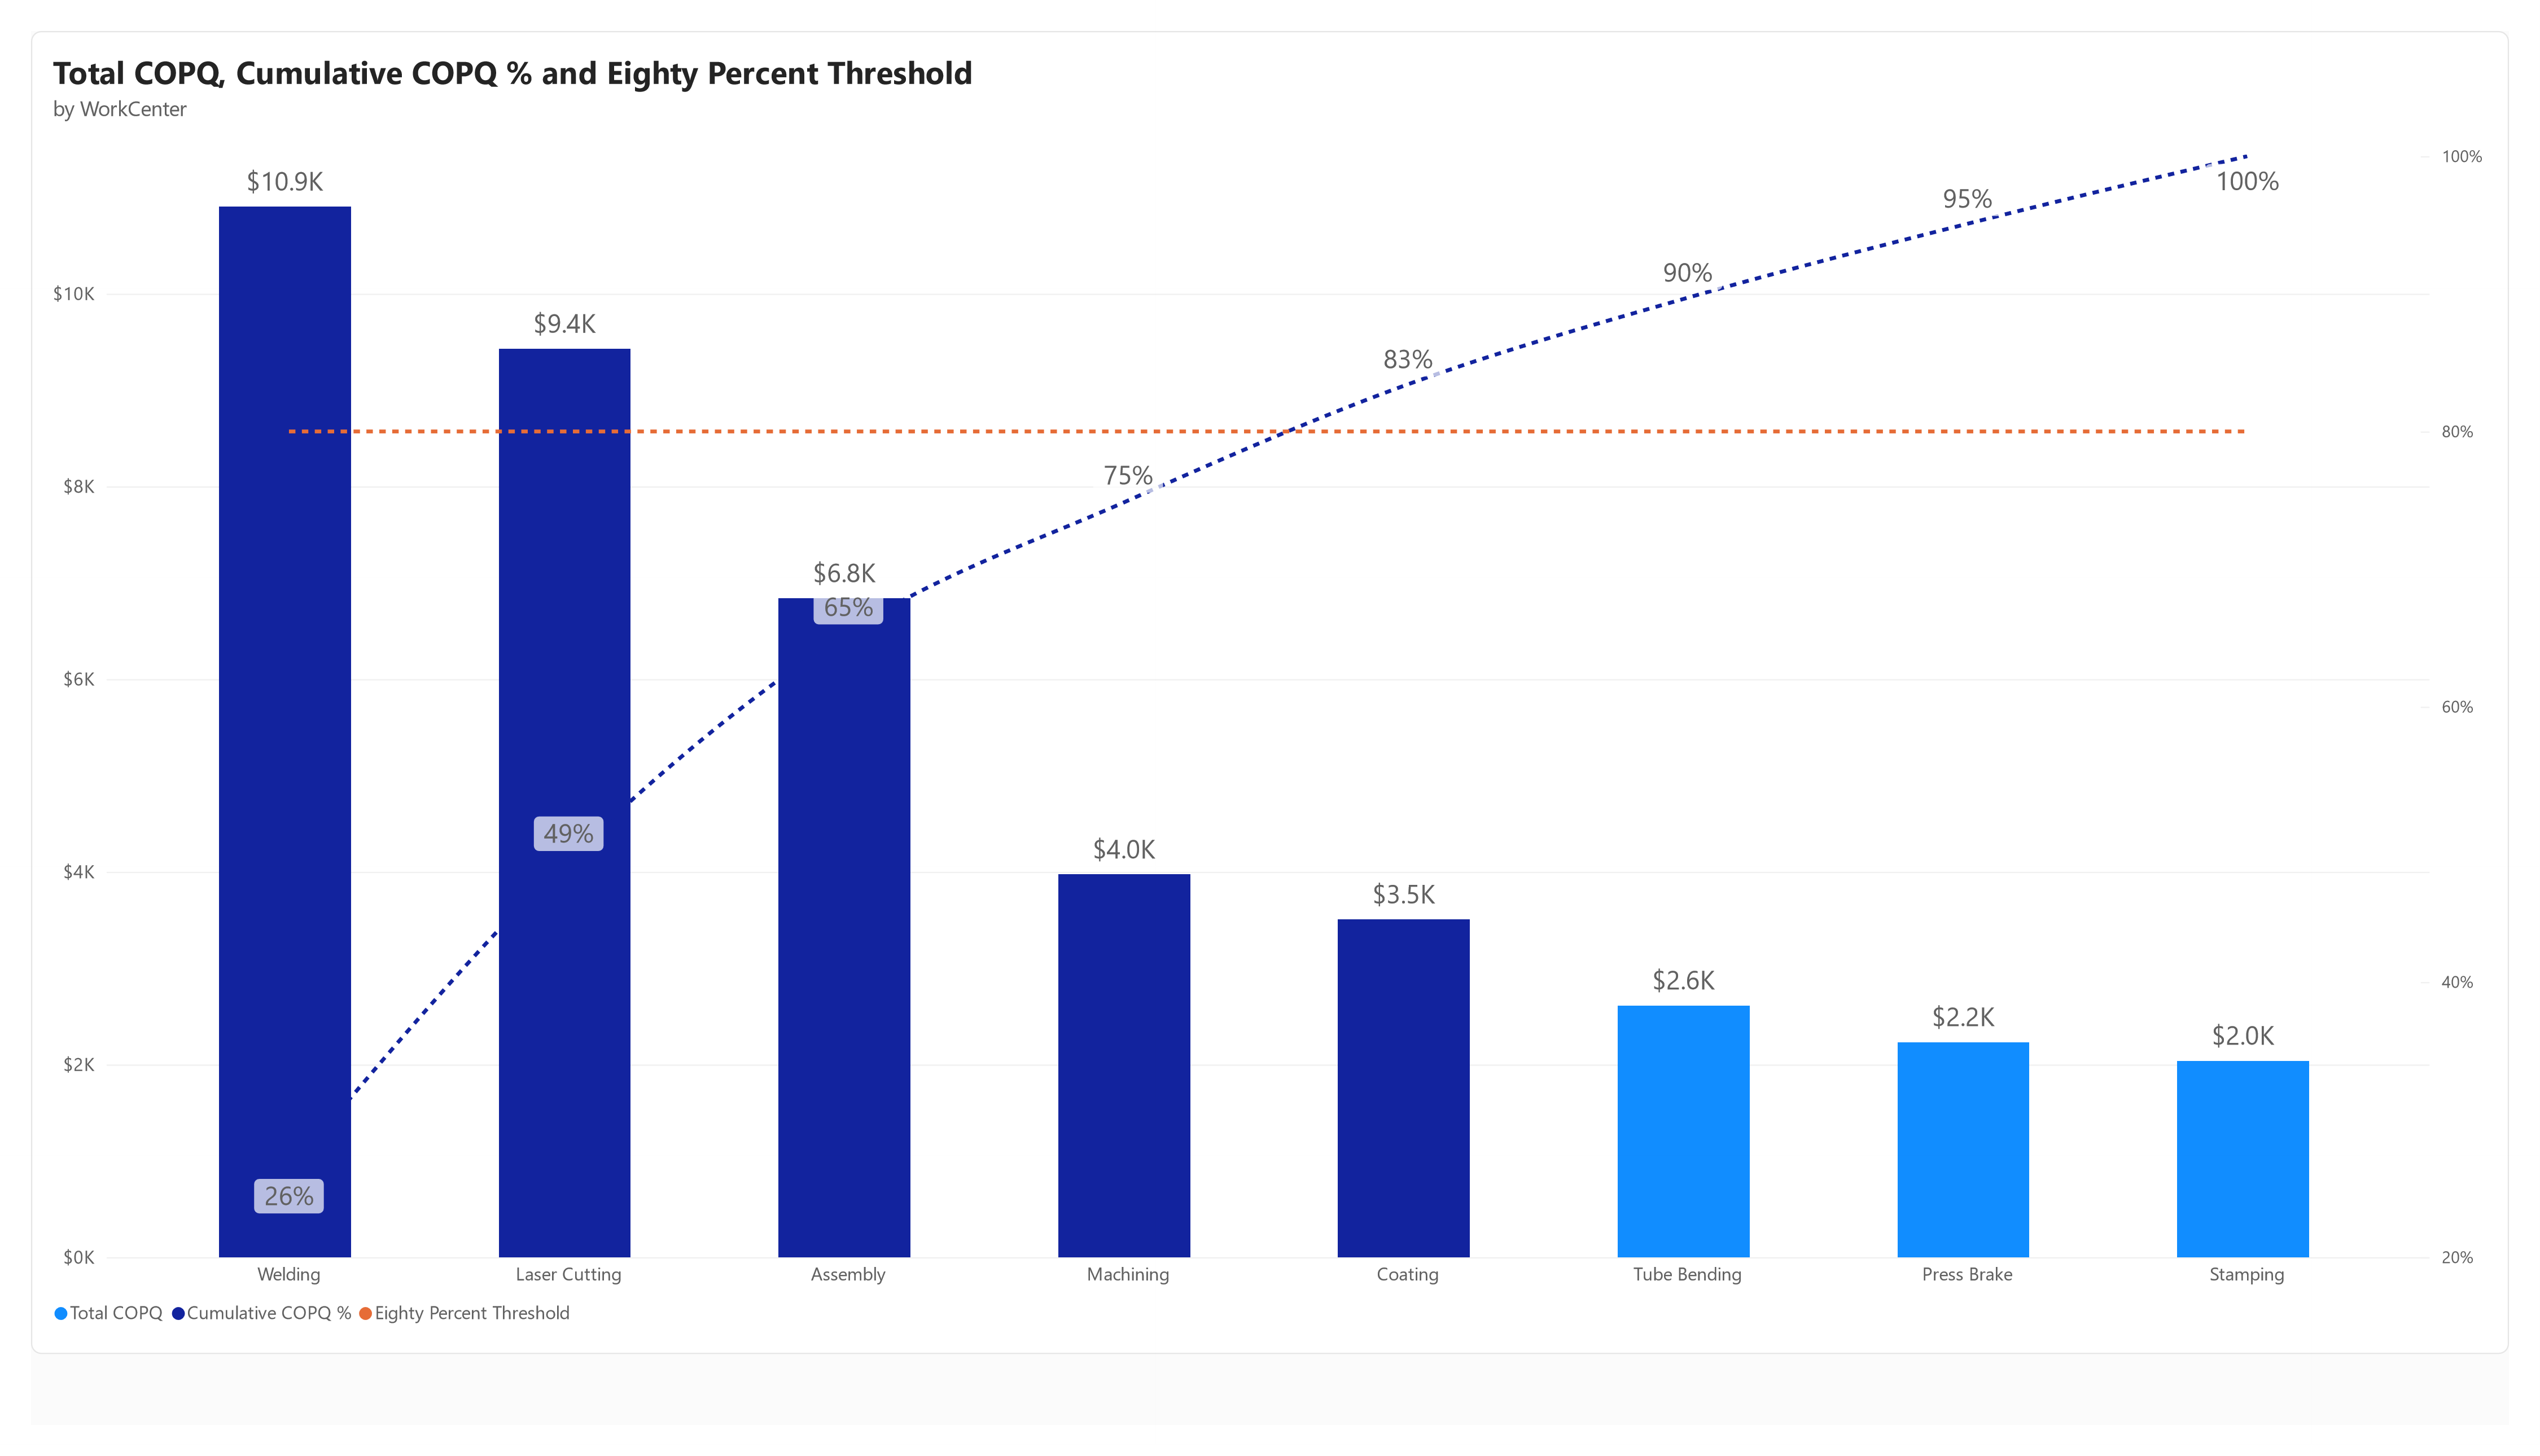
A Power BI report analyzing scrap and rework cost across a metal fabrication facility's 8 work centers, built with a DMAIC framework to find where quality cost concentrates.
Problem
Scrap and rework happen at every stage of fabrication. Individually they read as normal shop-floor noise. In aggregate, they're often the largest hidden cost in a job shop and a direct threat to on-time delivery.
Approach
Scoped all 8 work centers over 30 days and defined Cost of Poor Quality (scrap cost plus rework labor) as the core metric. Validated the Pareto logic in Excel first, then rebuilt it in Power BI with drill-through from work center down to individual defect records and a weekly trend line to track corrective action over time.
Finding
5 of 8 work centers drove roughly 83% of total quality cost, with Welding alone over a quarter of it. Drilling in showed the real driver wasn't weld failure. It was fitment/assembly error, redirecting the fix toward fixturing and part tolerances instead of welder technique.
Work Center Capacity & Bottleneck Report
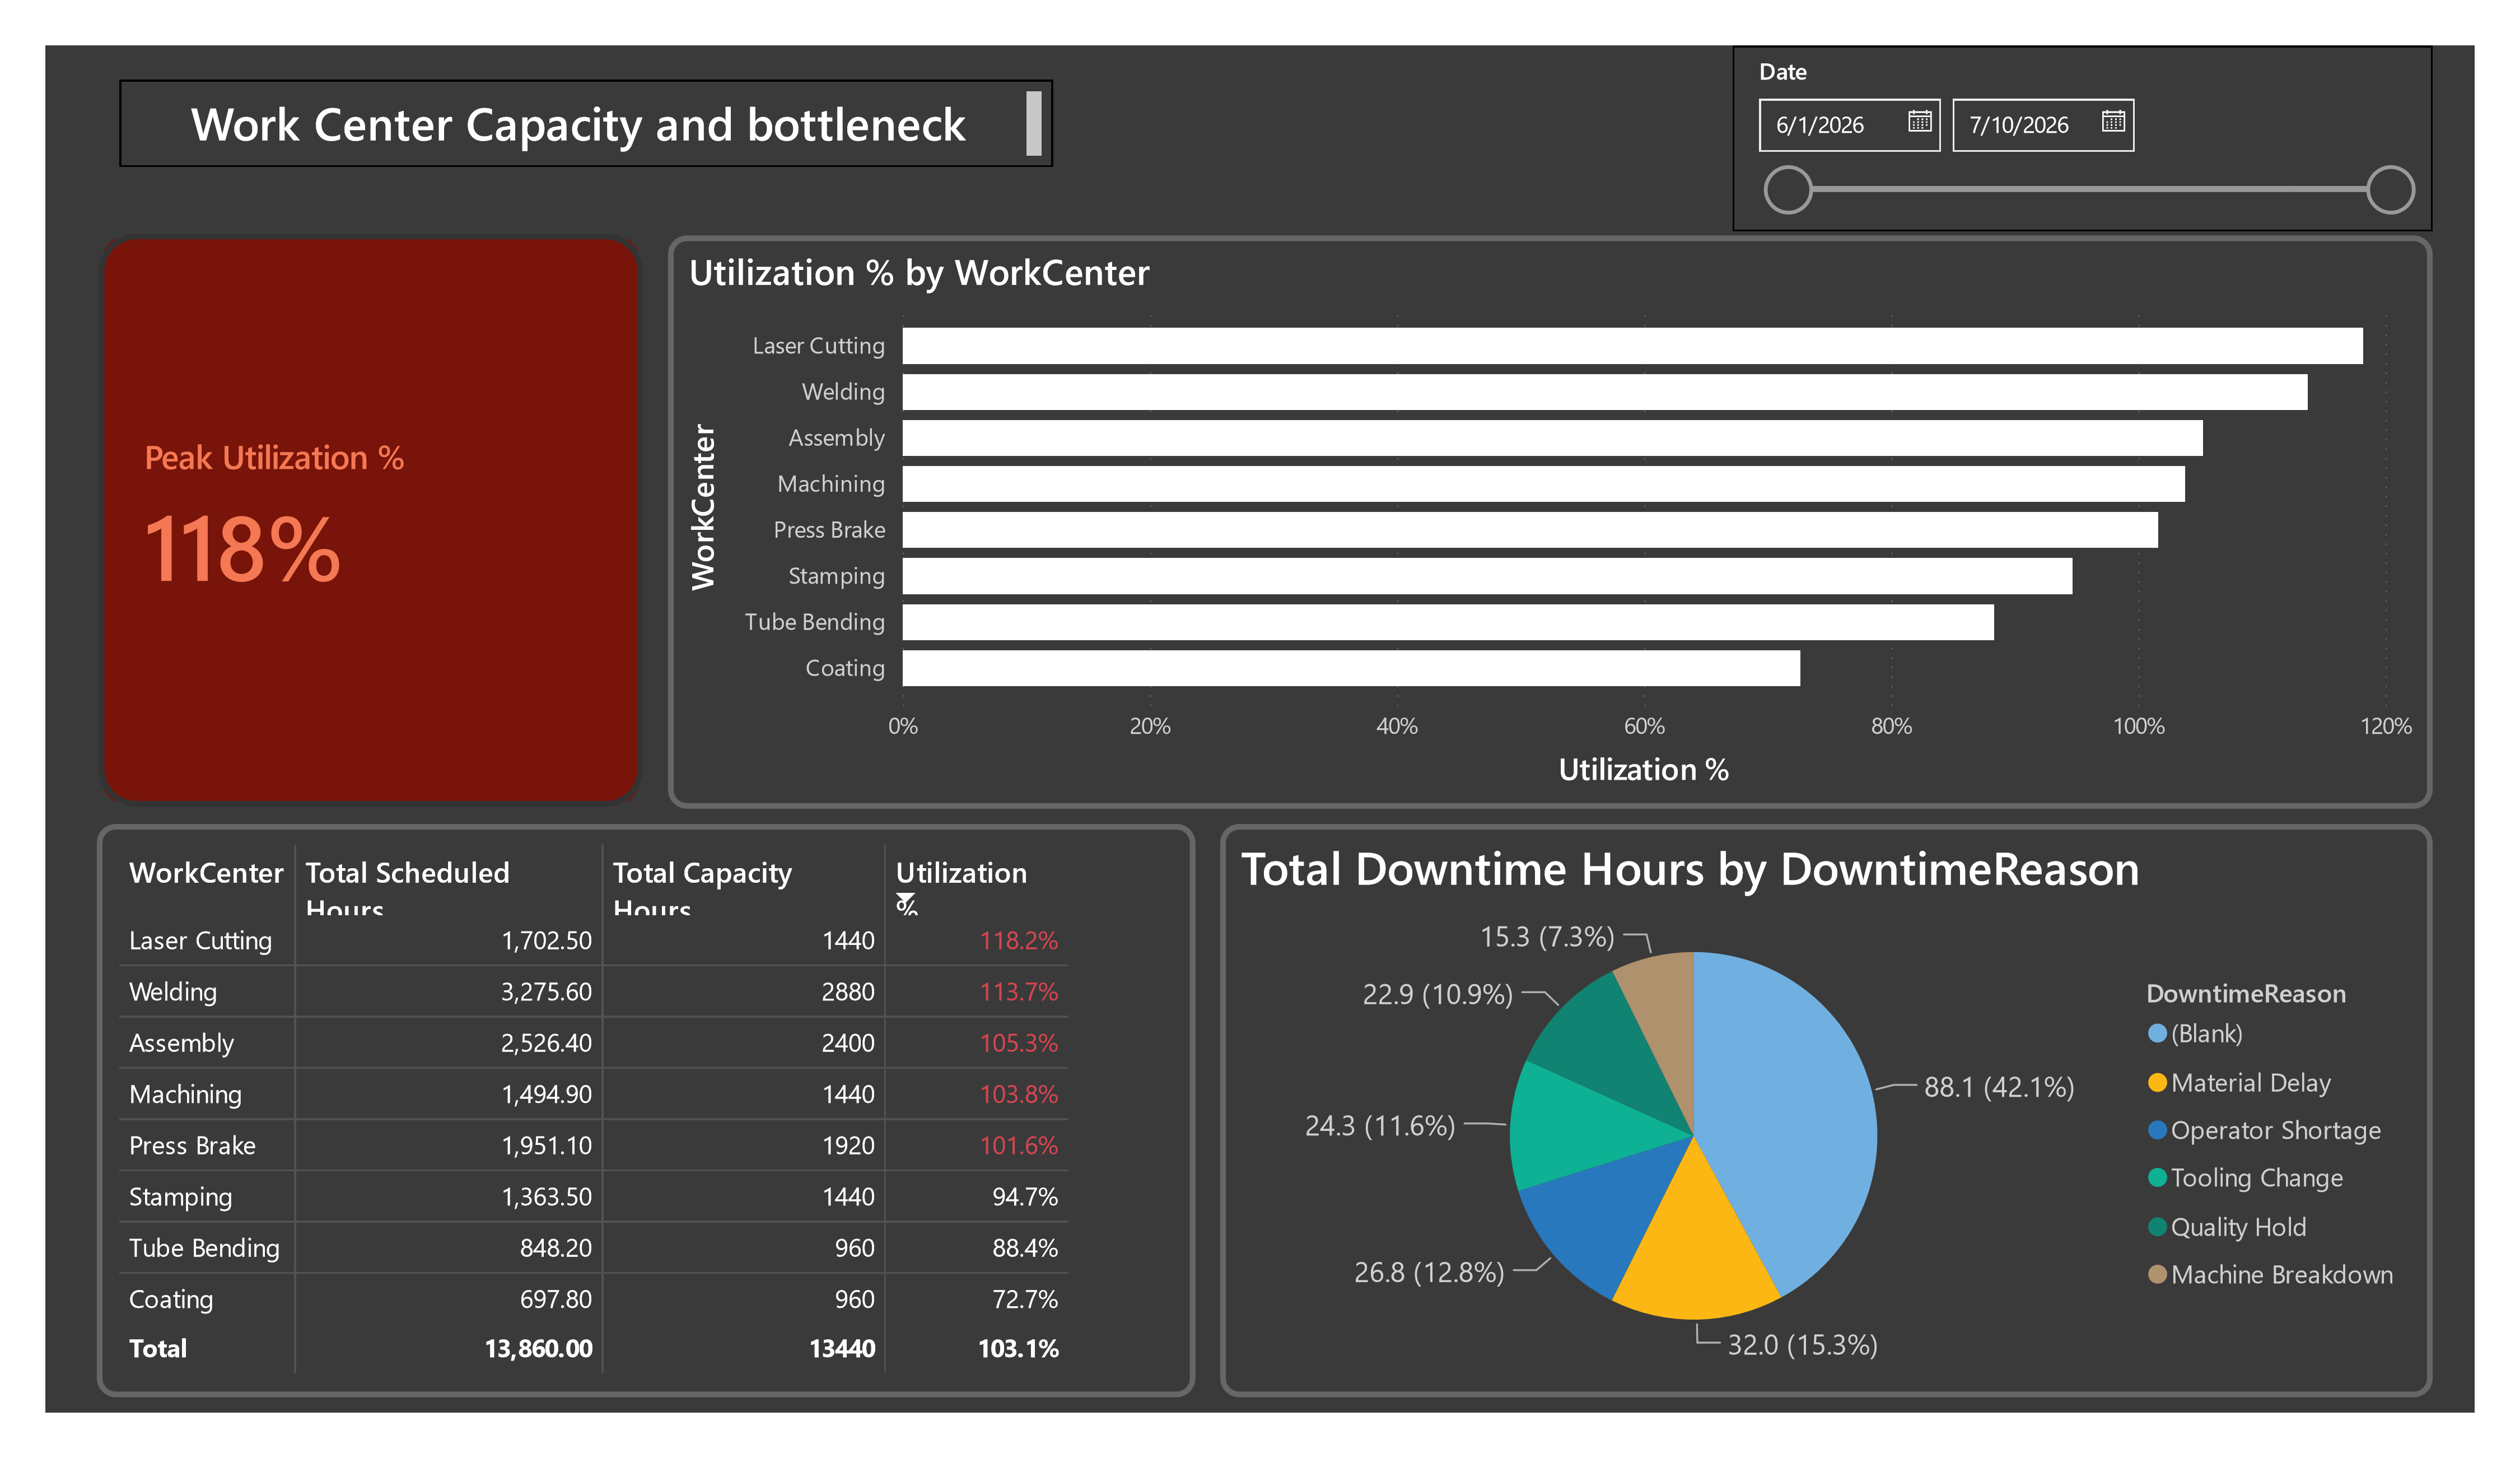
A Power BI report simulating a work-center capacity and scheduling problem, built to surface bottlenecks before they cause late shipments to customers.
Problem
Fabrication shops schedule jobs against work centers, each with fixed daily capacity. Without an aggregated view, chronically overbooked work centers go unnoticed until downstream jobs are already late.
Approach
Validated the utilization math in Excel first against a synthetic 813-row work-order dataset (8 work centers, 30 days) using PivotTables and VLOOKUP. Rebuilt it in Power BI with a proper data model and dynamic DAX measures, adding conditional formatting, a bottleneck KPI card, and a downtime-reason breakdown.
Finding
Two work centers ran chronically over capacity (above 110% utilization) while one sat under 75%. A mismatch that's invisible in a raw job list but obvious once aggregated and visualized.
On-Time Delivery Root-Cause Drill-Down
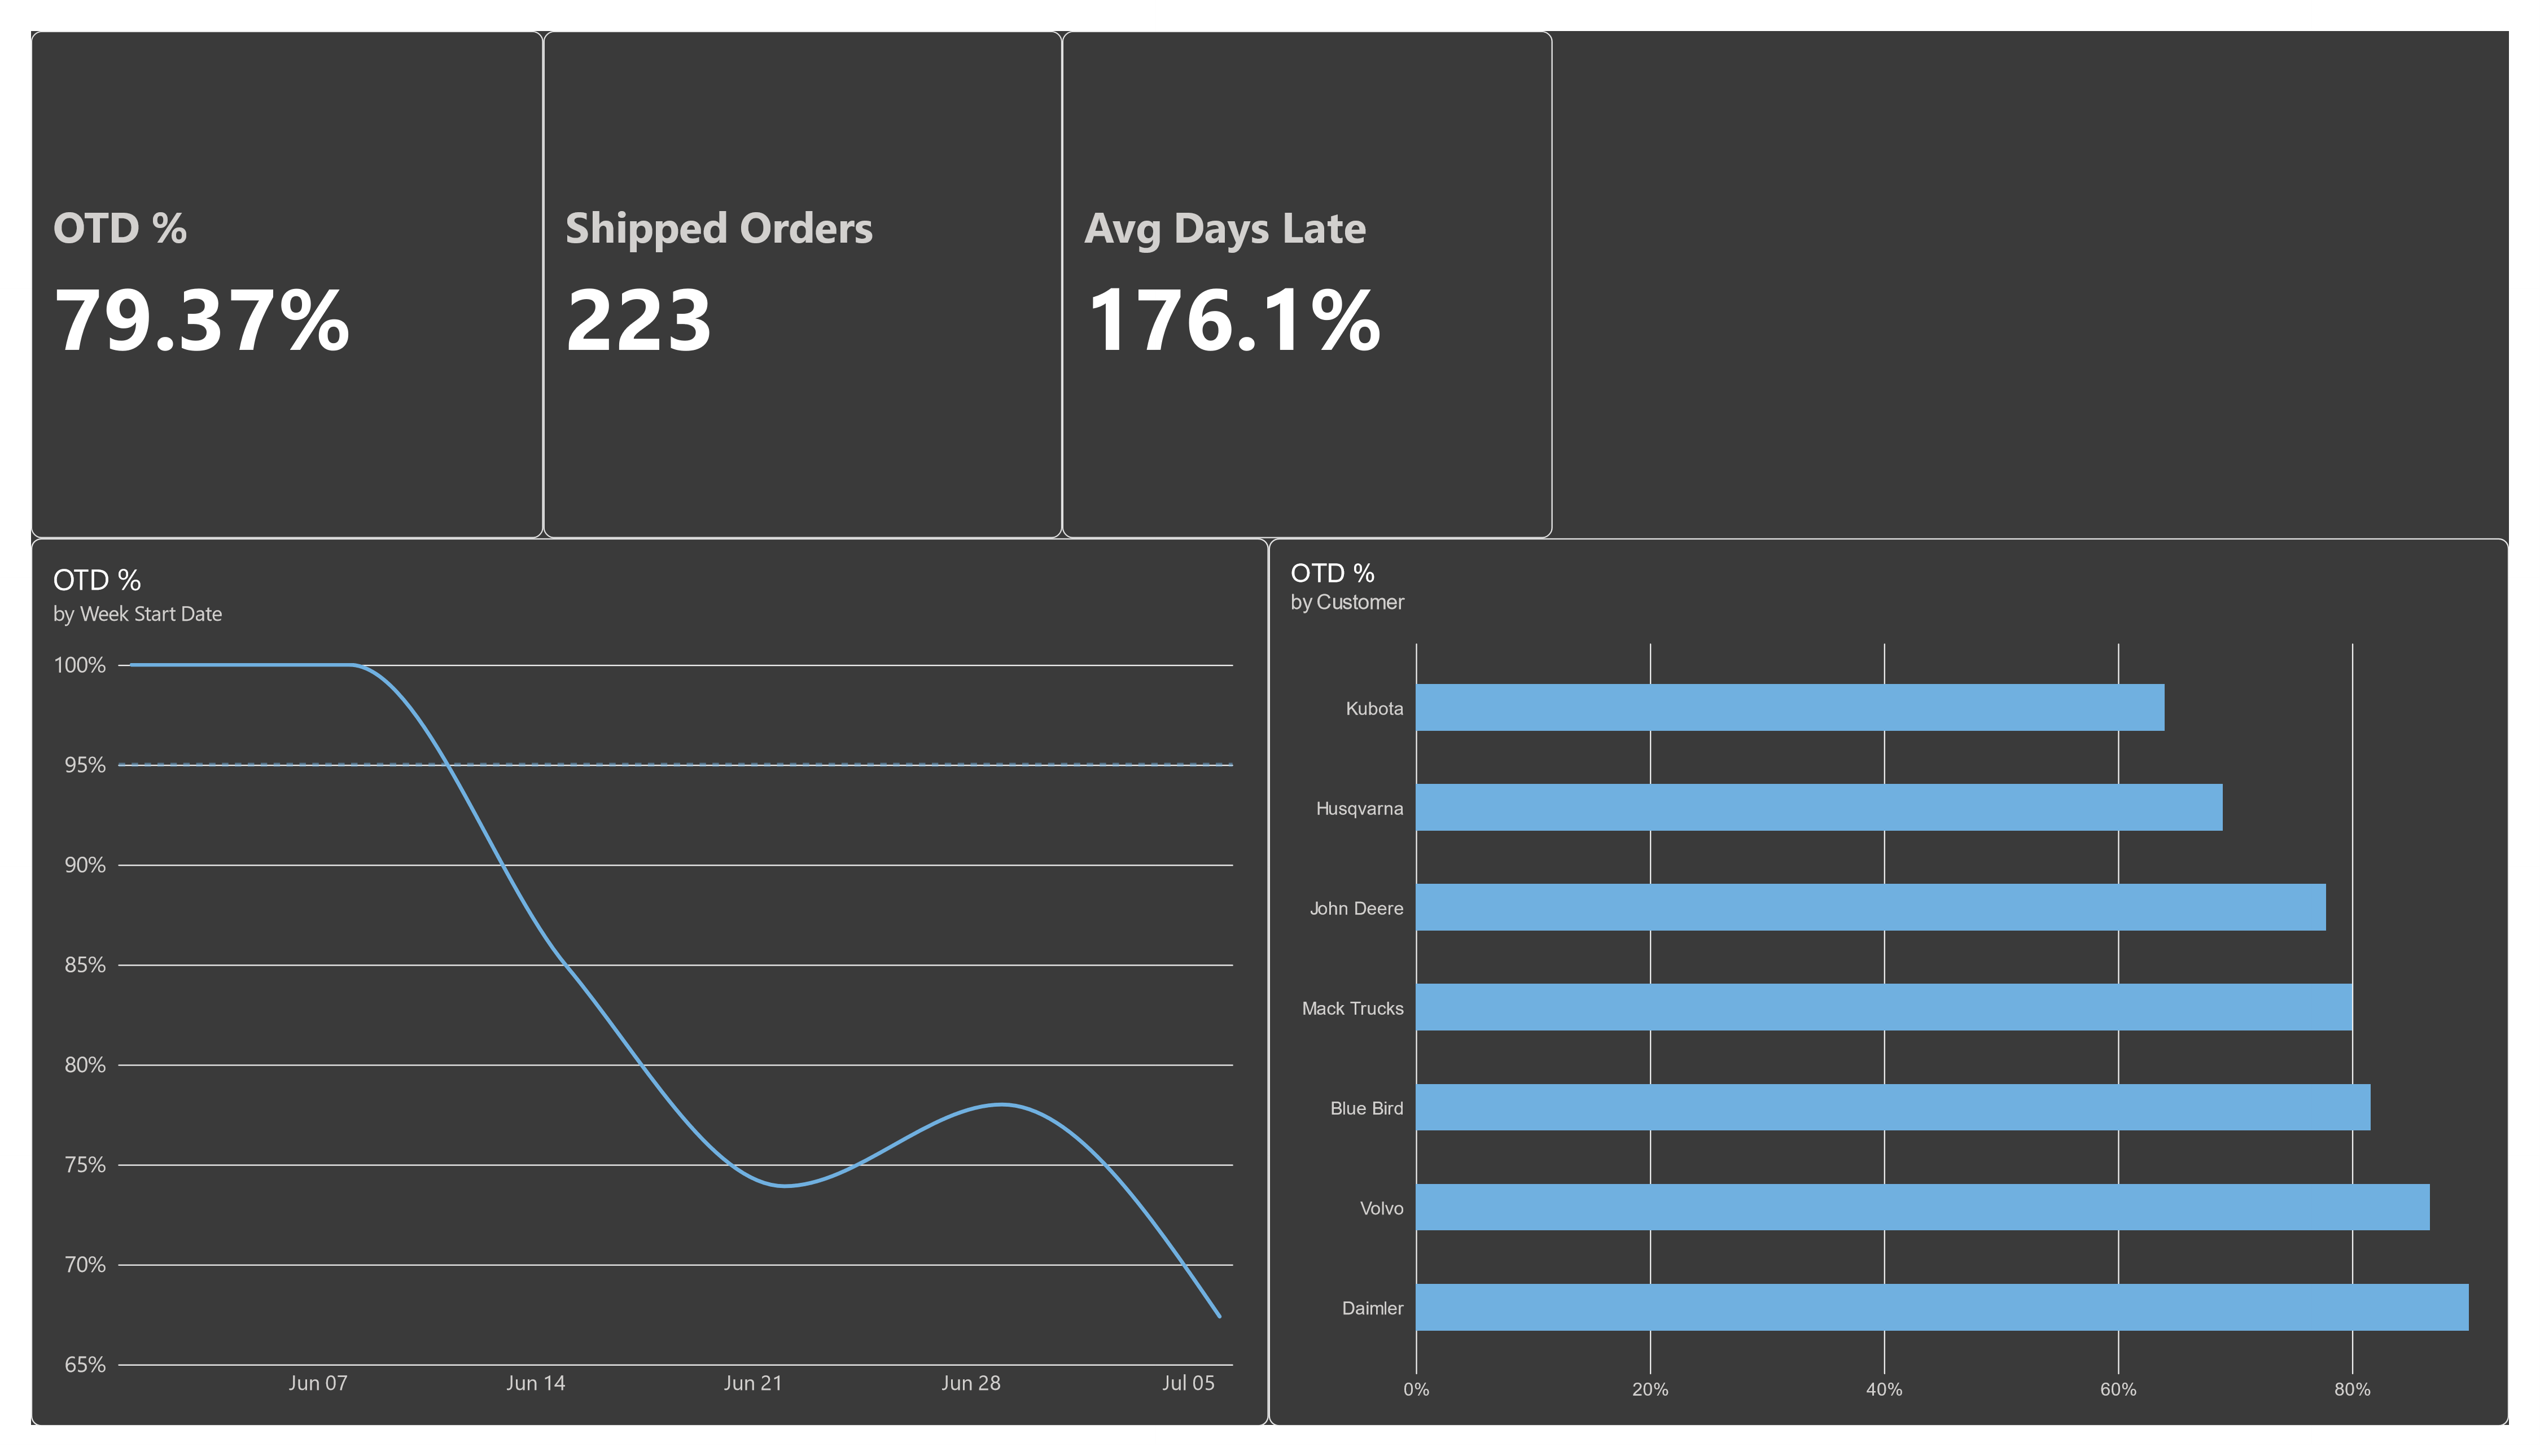
A Power BI report drilling from a slipping on-time delivery rate down to the work center and reason actually driving it.
Problem
On-time delivery had dropped from 100% to under 70% over five weeks, and it wasn't obvious why. A single OTD percentage says something is wrong. It doesn't say where to fix it.
Approach
Started with the weekly OTD trend and OTD by customer to confirm the drop was real and not one bad account. Replaced cumulative delay days, which overstates work centers late in the routing, with the delay each work center actually adds. Then compared OTD for orders routed through the top suspect work center against orders that weren't, and broke delay down by root cause instead of just location.
Finding
Orders routed through Welding shipped late far more often than orders that weren't: 71% on-time versus 90%. Capacity overload was the single largest delay reason, ahead of machine breakdown and material shortage. It's the same work center flagged as overbooked in the capacity report above.